Monitor site to site tunneling health for Cisco ASA using Zabbix


I'm getting troubled when it comes to monitor tunnel health using OID checking.
The problem was:
- On Cisco Devices, each tunnel session has different OID
- When tunnel disconnected, OID will disappear
- When tunnel reconnected, the previous OID will be gone and recreated with different OID
- By that case, we can't monitor the tunnel health using SNMP OID since the OID will be randomly changed. We don't want to change the OID manually each time the tunnel disconnect, do you?

In this post, I will show you how to monitor the VPN Tunnel Session health and alert us when the tunnel is disconnected. I'm importing script from cacti.

Requirement :

- Zabbix server ( I'm using Zabbix 2.4 in this post, I love vintage :p )
- Cisco ASA with tunnel site to site configured
- S2S Perl Script, download this one query_asa_S2S.pl (link edited, sorry if previous link was unable to view)

Here we go

1. Login to your Zabbix server, make sure your server installed with Net::SNMP module, if not you must install the package first. Use yum or anything and install Perl-Net-SNMP.

Eg: yum install Perl-Net-SNMP

2. Create new directory "externalscripts" on your /etc/zabbix

3. Copy the perl script to /etc/zabbix/externalscripts

4. Make sure the script is owned by user zabbix so zabbix server can use it

chown zabbix:zabbix /etc/zabbix/externalscripts/query_asa_s2s.pl

5. Lets test the script first to make sure the script is work well

Usage :
query_asa_S2S.pl <community> <host> {ASA,CONCENTRATOR} index
Give you the list of vpn connected session IP
query_asa_S2S.pl <community> <host> {ASA,CONCENTRATOR} query {RX,TX}
Give you the list of vpn connected session along with TX/RX Traffic
query_asa_S2S.pl community host {ASA,CONCENTRATOR} get {RX,TX} <peer>
Give you the TX/RX of the single session

6. If there is no error, its time to implement the result to Zabbix.

- On your server console, open zabbix-server.conf
- Uncomment the line ExternalScripts=/etc/Zabbix/externalscripts and point it to your externalscripts directory (2)
- Restart the Zabbix-server services if needed

7. Open zabbix web console, create new Template "Template S2S ASA"

8. Create new item on that template "IPSec Tunnel <your session> - Inbound"

Set the value like this, key format should be " query_asa_s2s.pl[{$SNMP_COMMUNITY},{HOST.CONN},ASA,get,RX,<session ip>]

9. Create second item "IPSec Tunnel <your session> - Outbound"

Set the value like this, key format should be " query_asa_s2s.pl[{$SNMP_COMMUNITY},{HOST.CONN},ASA,get,TX,<session ip>]

10. Create 3rd item "IPSec Tunnel Status" This item give us the list of connected session

Set the value like this, the key format should be " query_asa_s2s.pl[{$SNMP_COMMUNITY},{HOST.CONN},ASA,index]

11. Attach the Template to your Firewall ASA host, you need to have one and make sure its reachable by Zabbix.

11. Wait for 5 minutes, and lets see the on the Latest Data, if the script work well, the value will comes up.

12. Setup the trigger depend on your needs. In my cases, I need to monitor the one of the session. If that session is down, the trigger will send to me.

- Create new Trigger " S2S to <your session ip> Disconnected
- Add Expression, Select Item on point (10)
- Set Function = " Find string V in last (most recent) value. N = 1 - if found, 0 - otherwise "
- Set V = < your session ip > ( the one you want need to be monitored )
- Last of (T) = 30 ( let say it's 30 seconds"
- N = 0
- Insert

Let me explain you a bit about this trigger. Item (10) gather value the ( List of connected session )  so I set the trigger " If within 30 seconds, last value doesn't have the string < V / session IP > in the result, the trigger will activate"


How to Run Python Script on Startup in Linux


Sometimes,we need to run python scripting manually when our linux machine doing any reboot.
This can be solved with adding the script to rc.local configuration.
this rc file will be run when we doing boot.
To know more about booting process you can read it here.

Ok,here is the step to add the script to rc.local file
For example,i have sd-agent python script for my monitoring stuff.
This file located at my root directory


I need to run the agent.py file everytime my machine start up.
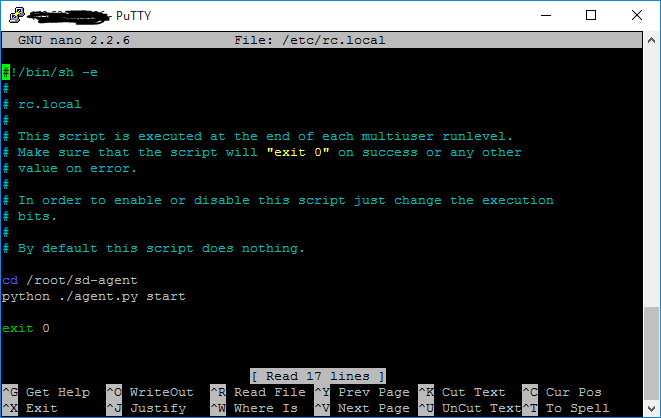
So i will add the script agent.py to rc.local file

# edit the rc.local file
nano /etc/rc.local
# add the url path to the file,make sure you write them above the exit 0 line
cd /root/sd-agent
python ./agent.py start

Note : my agent.py script need to read the file config.cfg , so cd /root/sd-agent on the rc.local configuration is needed because config.cfg is located there.

# make sure the python script running on rc.local file
cd sd-agent
python agent.py stop
ps aux | grep agent

The script has been stopped.
Try to run the script via rc.local file,which is autorun when boot.
/etc/rc.localps aux | grep agent

Ok,so the script has been started when we run the rc.local file

Thank you,share if you like this article !


How To Check Raid Status and Replace Using Megacli

On
In this case,im using raid 1 with 2 physical drive.

  • Check the Raid status using this command

[root@linux ~]# /opt/MegaRAID/MegaCli/MegaCli64 -LDInfo -Lall -aALL -NoLog

Adapter 0 -- Virtual Drive Information:
Virtual Drive: 0 (Target Id: 0)
Name                :
RAID Level          : Primary-1, Secondary-0, RAID Level Qualifier-0
Size                : 136.125 GB
Mirror Data         : 136.125 GB
State               : Degraded
Strip Size          : 64 KB
Number Of Drives    : 2
Span Depth          : 1
Default Cache Policy: WriteBack, ReadAheadNone, Direct, No Write Cache if Bad BBU
Current Cache Policy: WriteBack, ReadAheadNone, Direct, No Write Cache if Bad BBU
Default Access Policy: Read/Write
Current Access Policy: Read/Write
Disk Cache Policy   : Disk's Default
Encryption Type     : None
Is VD Cached: No


Exit Code: 0x00
# from those result,we should know that i'm using Raid 1 with 2 physical drive.
And the raid status is Degraded,we need to replace the bad drive.

  • Check which drive is bad

Use this command to list all physical drive with their status
[root@web01 ~]# /opt/MegaRAID/MegaCli/MegaCli64 -PDList -aALL

Adapter #0

Enclosure Device ID: 32
Slot Number: 0
Drive's postion: DiskGroup: 0, Span: 0, Arm: 0
Enclosure position: N/A
Device Id: 0
WWN:
Sequence Number: 2
Media Error Count: 0
Other Error Count: 0
Predictive Failure Count: 0
Last Predictive Failure Event Seq Number: 0
PD Type: SAS

Raw Size: 136.732 GB [0x11177328 Sectors]
Non Coerced Size: 136.232 GB [0x11077328 Sectors]
Coerced Size: 136.125 GB [0x11040000 Sectors]
Firmware state: Online, Spun Up
Device Firmware Level: S527
Shield Counter: 0
Successful diagnostics completion on :  N/A
SAS Address(0): 0x5000c5000aaff44d
SAS Address(1): 0x0
Connected Port Number: 0(path0)
Inquiry Data: SEAGATE ST3146855SS     S5273LN5G5KH
FDE Capable: Not Capable
FDE Enable: Disable
Secured: Unsecured
Locked: Unlocked
Needs EKM Attention: No
Foreign State: None
Device Speed: Unknown
Link Speed: Unknown
Media Type: Hard Disk Device
Drive Temperature :26C (78.80 F)
PI Eligibility:  No
Drive is formatted for PI information:  No
PI: No PI
Port-0 :
Port status: Active
Port's Linkspeed: Unknown
Port-1 :
Port status: Active
Port's Linkspeed: Unknown
Drive has flagged a S.M.A.R.T alert : No


Enclosure Device ID: 32
Slot Number: 1
Drive's postion: DiskGroup: 0, Span: 0, Arm: 1
Enclosure position: N/A
Device Id: 1
WWN:
Sequence Number: 3
Media Error Count: 7
Other Error Count: 1
Predictive Failure Count: 0
Last Predictive Failure Event Seq Number: 0
PD Type: SAS

Raw Size: 136.732 GB [0x11177328 Sectors]
Non Coerced Size: 136.232 GB [0x11077328 Sectors]
Coerced Size: 136.125 GB [0x11040000 Sectors]
Firmware state: Failed
Device Firmware Level: S527
Shield Counter: 0
Successful diagnostics completion on :  N/A
SAS Address(0): 0x5000c5000aaffaf9
SAS Address(1): 0x0
Connected Port Number: 1(path0)
Inquiry Data: SEAGATE ST3146855SS     S5273LN5G42B
FDE Capable: Not Capable
FDE Enable: Disable
Secured: Unsecured
Locked: Unlocked
Needs EKM Attention: No
Foreign State: None
Device Speed: Unknown
Link Speed: Unknown
Media Type: Hard Disk Device
Drive Temperature :26C (78.80 F)
PI Eligibility:  No
Drive is formatted for PI information:  No
PI: No PI
Port-0 :
Port status: Active
Port's Linkspeed: Unknown
Port-1 :
Port status: Active
Port's Linkspeed: Unknown
Drive has flagged a S.M.A.R.T alert : No


Exit Code: 0x00


# From those result,there are 2 drive slot 0 and slot 1
slot 0 : Firmware state Online,spun up and no error (this drive should be normal)
slot 1 : Firmware state Failed ,Media error count 7 Other error count 1 (this should be the bad one)

slot 1 need to be replaced,so we should replace the second drive

  • replace the second drive

it should be auto rebuild afterward

  • Done !


# Megacli command reference : https://supportforums.cisco.com/document/62901/megacli-common-commands-and-procedures
# Megacli Raid level explanation : https://globalroot.wordpress.com/2013/06/18/megacli-raid-levels/


Install Zabbix Agent on Debian


  • Install repository configuration package

get the suitable package for your machine

#cat /etc/debian_version
download from repo.zabbix.com based from your version.
example,my debian version is wheezy

# wget http://repo.zabbix.com/zabbix/2.0/debian/pool/main/z/zabbix-release/zabbix-release_2.0-
1wheezy_all.deb

#dpkg -i zabbix-release_2.0-1wheezy_all.deb

#apt-get update

  • Install zabbix agent
#apt-get install zabbix-agent

  • edit configuration file
#nano /etc/zabbix/zabbix_agentd.conf

Basic configuration file

PidFile=/var/run/zabbix/zabbix_agentd.pid
LogFile=/var/log/zabbix/zabbix_agentd.log
LogFileSize=0
# zabbix server
Server=yourzabbixserverip
ServerActive=yourzabbixserverip
Hostname=zabbixagenthostname
#DisablePassive=1
#DisableActive=0
#DebugLevel=4

restart the agent service
#/etc/init.d/zabbix-agent restart

check the startup config
#ls /etc/rc*.d

DONE !


How to SSH using .pem Private key


  • make sure you own .pem key file on your local machine.
  • use this command :
ssh -i /path/yourkey.pem -l username ipaddress

  • make sure permission for .pem file is 400,otherwise it will shown this error

Permissions 0644 for 'yourkey.pem' are too open.
It is required that your private key files are NOT accessible by others.
This private key will be ignored.
bad permissions: ignore key: cozi.pem


  • you can check your current permission using

ls -l /path/yourkey.pem

  • standard permission for .pem file are 400 which is user read only,to change permission use this
chmod 400 /path/yourkey.pem

  • You should be logged in now.


How to Add Raid Monitoring to Zabbix Agent

In this case,we need to add raid monitoring to notify us if there is an error with the raid.
note: i'm using MegaCli for this


  • Login to zabbix server web interface
  • add new template,name Template_LSI_RAID_Active
  • add new application into it,name RAID
  • add item,set value similar with this

  • add trigger,set value like this 


Back to template list,and select you new LSI Template,

  • add Macro 
{$EXPECTED_OPTIMAL_LDS} set value to 1

 *you should have new template now,it can be used to another host

  • Link your host with LSI Template,it should have new triggers about Raid Status
  • Login to your linux agent,
  • edit your conf 

nano /etc/zabbix/zabbix_agentd.conf

- add this to end of configuration line

UserParameter=raid.lsimegaraid.numoptimallds,sudo /opt/MegaRAID/MegaCli/MegaCli64 -LDInfo -Lall -aALL -NoLog | grep  '^State[[:space:]]\+:[[:space:]]\\*Optimal' | wc -l
  • save file and restart agent
/etc/init.d/zabbix-agent restart

- It should be done.

Let me explain about this .conf new value :
  • UserParameter=raid.lsimegaraid.numoptimallds = used to add new task for agent,in this case it will run trigger match up with "key" raid.lsimegaraid.numoptimallds (your LSI key)
  • sudo /opt/MegaRAID/MegaCli/MegaCli64 -LDInfo -Lall -aALL -NoLog = this is command to check the status of RAID,you can run this on the console
[root@linux ~]# /opt/MegaRAID/MegaCli/MegaCli64 -LDInfo -Lall -aALL -NoLog

Adapter 0 -- Virtual Drive Information:Virtual Drive: 0 (Target Id: 0)Name                :RAID Level          : Primary-1, Secondary-0, RAID Level Qualifier-0Size                : 456.175 GBMirror Data         : 456.175 GBState               : OptimalStrip Size          : 64 KBNumber Of Drives    : 2Span Depth          : 1Default Cache Policy: WriteBack, ReadAheadNone, Direct, No Write Cache if Bad BBUCurrent Cache Policy: WriteBack, ReadAheadNone, Direct, No Write Cache if Bad BBUDefault Access Policy: Read/WriteCurrent Access Policy: Read/WriteDisk Cache Policy   : Disk's DefaultEncryption Type     : NoneIs VD Cached: No
  • grep  '^State[[:space:]]\+:[[:space:]]\\*Optimal' = used to find character inside the result of above command,this is regexp related.
  • wc -l = to give us the count of character found by above command.


If we combine all of that command,we will find this
[root@linux ~]# /opt/MegaRAID/MegaCli/MegaCli64 -LDInfo -Lall -aALL -NoLog | grep  '^State[[:space:]]\+:[[:space:]]\\*Optimal' | wc -l
1

That mean,by running that raid check command,we find 1 variable that says "Optimal" and wc -l tell us by number
we got a conclusion that our raid was no error.Got this ?

Here is the process :
  • Agent send the data
  • Zabbix server will have that "1" value,match up with macros {$EXPECTED_OPTIMAL_LDS}


*If raid was error,macro should get "0" value instead of "1",because wc - l doesnt find any "Optimal" variable.
because of "0" doesn't match up with macros value,they will give alert regarding to this.

I hope you got my explanation
Cheers !